LIFT/DRAG GRAPH SCREEN
 This screen is a tab MDIMDI style screen. To change from viewing lift data to drag data simply click on the tab at the top of the screen. To compare multiple airfoils a number of these screens can be opened for each airfoil. The data shown is for the currently selected airfoil in the airfoil list. To view the data of another airfoil, select an airfoil from the airfoil list screen using the mouse and click on the GRAPH button next to the comments. The thick black line indicates that the screen can be altered by the user to size the portion of the screen which contains the graph. To increase the area for the graph, move the mouse pointer over the black line and drag the line up or down . The mouse pointer will change as you move over this line. The graph size is proportional to the window size. It will automatically change size as the screen changes in size.
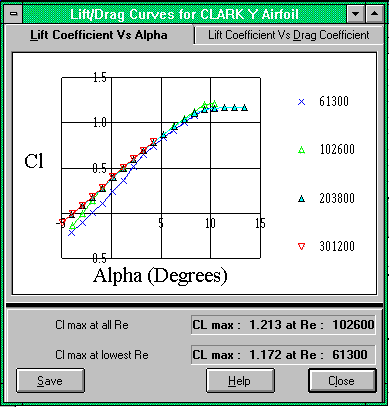
The data on this screen is supplied as two separate graphs. The first is the lift coefficient (Cl) vs. angle of attack (Alpha) in degrees. The second is lift coefficient vs. drag coefficient. Data is provided for a number of Reynolds number readings. As model aircraft typically fly at low Reynolds numbers (ie; small wing chords at low speeds) an airfoil which has a high lift coefficient and low drag coefficient at a low Reynolds number will have the best all-round performance. In general most airfoils suffer a loss in performance with a reduction in Reynolds numbers. If you choose an airfoil which performs well at a low Reynolds number , the same airfoil will typically perform much better at higher Reynolds numbers.
To determine the reynolds number for a wing or tail design use the REYNOLDS NUMBER GRAPHREYNOLDS_NUMBER_GRAPH_SCREEN facility provided with the WING CAD SCREENWING_CAD The higher the lift coefficient(Cl) the greater the lift produced by an airfoil and the lower the stall speed for a given wing area. The lower the drag coefficient(Cd) , the lower the profile drag for a given wing or tail area. Low drag is required for Pylon and Sailplane designs. Funfly designs rely on high drag sections for even speed through manoeuvres. Please note that this data is for infinite aspect ratios . The actual lift and drag coefficients for real designs will be lower and higher depending on the Aspect Ratio of the wing or tail. Aspect ratio is calculated as follows;
Ratio = ( Wing Span)2 / Wing Area
High Aspect Ratio (long narrow wings) reduces Induced drag but lowers Reynolds Number (low airfoil performance) and increases structural loading (good for gliding). Reduces roll rate (high inertia).
Low Aspect Ratio (short wide wings) increases Induced drag but increases Reynolds Number (good airfoil performance) and reduces structural loading ( good for aerobatics). Improves roll rate.
The higher the Aspect Ratio the closer the performance of the wing or tail will match the test data.
There are three buttons on this screen.
Save Button
This button provides the capability to save the currently viewed graph as a windows bitmap graphic file. The graphic file can be viewed at a later date or pasted into a document.
Help Button
This button invokes on-line Help for this screen.
Close Button
This button closes this screen.
To print a graph
Select the PRINT menu item in the FILE menu or click on the  tool bar button.
 Tip A good way of viewing and comparing airfoils is to open this screen for 4 different airfoils. Close or minimize the Airfoil List screen and any other screens apart from the Lift/drag Graph screens. Click on the Window Tile Vertical menu. You can then easily view data for all 4 airfoils.