REYNOLDS NUMBER GRAPH SCREEN
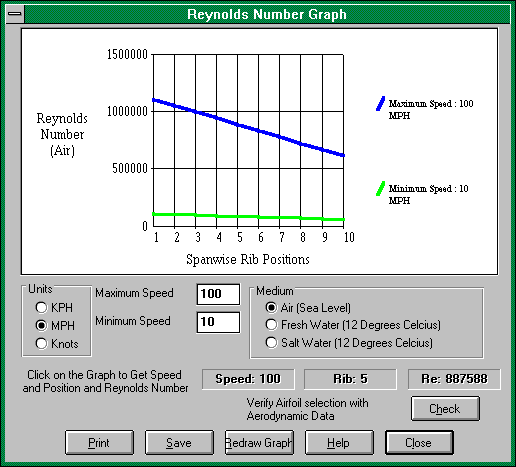
This screen is used to determine the Reynolds number distribution along the span of a wing or tail.
Graphing Steps;
1. Select a unit of measurement from KPH(Kilometres per hour), MPH (Miles per hour) and
KNOTS (Nautical miles per hour).
Typical maximum speeds in MPH for model aircraft are;
|
|
Glider |
80 |
|
|
Trainer |
100 |
|
|
Sport |
100 |
|
|
Pattern |
120 |

2. Enter maximum and minimum speeds .
3. Select fluid medium from Air, Fresh Water or Salt Water.
4. Click on the REDRAW GRAPH button.
Clicking on the graph will cause the reading to be displayed at the bottom of this screen.
Multiple clicks at the same position will toggle between the minimum and maximum speed ranges.
To print the graph;
Click on the PRINT button.
To save the graph as a bitmap picture file;
Click on the SAVE button.
To verify airfoil selection with graph;
Click on the CHECK button. This action will cause the AIRFOIL SELECTION VERIFICATIONAIRFOIL_VERIFICATION_SCREENscreen to appear.
To exit this screen;
Click on the CLOSE button