VERTICAL TAIL GRAPH SCREEN
This screen is used to determine the vertical tail size for adequate static stability for conventionally configured aircraft.
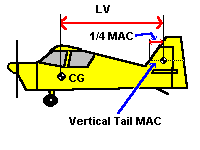
{bml bm84.BMP}The value Lv is the distance from the quarter chord of the vertical tail Mean Aerodynamic Chord to the centre of gravity of the aircraft. The value Vv is the vertical tail volume coefficient. The higher this value is , the higher the degree of yaw stability. Typical light aircraft have a value of 0.04. The practical range is between 0.03 and 0.06.
The Y axis of the graph is the required vertical tail area. The X axis of the graph is the ratio of the wing span and Lv. The higher this ratio the less vertical tail area is required for a given vertical tail volume coefficient ie; a vertical tail along way from the centre of gravity of the aircraft has more effect than a similar sized tail closer to the centre of gravity.
Values may be read off the graph by clicking anywhere within the boundaries of the graph.
Repeatedly clicking on one spot will cause the value for the tail area to be shown for each of the tail volume coefficients plotted.
The diagram below shows the relationship of the dimensions.
The selection of a suitable tail area would be performed as follows;
1. Select a suitable Vv value eg; 0.04
2. Determine the distance between the tail quarter chord of the tail MAC and the aircraft .
3. Click on the graph at the value for the SPAN/Lv. Continue to click until the value for a
Vv equal to 0.04 is obtained.
Alternatively, print out the graph and interpolate for the SPAN/Lv and Vv equal to 0.04.
To print the graph;
Click on the PRINT button.
To save the graph as a bitmap picture file;
Click on the SAVE button.
To exit this screen;
Click on the CLOSE button.